Resting-state fMRI: Overview
A Brief Introduction to Resting-State fMRI
What Is Resting-State fMRI?
One of the most influential discoveries in modern neuroscience is that the brain remains highly active even when we are not performing any explicit task.
In resting-state functional MRI (rs-fMRI), participants are typically instructed to lie still in the scanner, remain awake, and either keep their eyes open or closed. Unlike task-based fMRI, no specific task is performed.
At first glance, this may seem uninteresting. However, researchers discovered that spontaneous fluctuations in brain activity are far from random. Instead, brain regions exhibit coordinated patterns of activity, suggesting that they are communicating and functioning together as part of larger networks.
Resting-state fMRI allows researchers to investigate the brain’s intrinsic functional organization—that is, how different brain regions interact in the absence of an externally imposed task.
Historical Background
The modern field of resting-state fMRI is often traced to a landmark study by Biswal and colleagues (1995).
While studying the motor system, the researchers observed that spontaneous fluctuations in activity were highly correlated between the left and right motor cortices, even when participants were not performing any movement. This finding suggested that functionally related brain regions remain synchronized during rest.
This discovery was initially surprising. At the time, many researchers viewed resting periods simply as a baseline against which task-related brain activity could be measured.
Over the following decades, resting-state fMRI grew into one of the most widely used approaches in neuroscience. Researchers discovered that the brain contains multiple large-scale networks that consistently appear across individuals and are present even when people are not engaged in a specific task.
Today, resting-state fMRI is used extensively to study cognition, development, aging, individual differences, and neurological and psychiatric disorders.
Time Series: The Building Block of Functional MRI
Recall that resting-state fMRI measures changes in brain activity over time. For any given brain region, we can track how its fMRI signal fluctuates throughout the scan. The resulting sequence of measurements is known as a time series.
Each brain region therefore has its own time series describing how its activity changes over time. Some regions may show similar fluctuations, whereas others may behave quite differently.
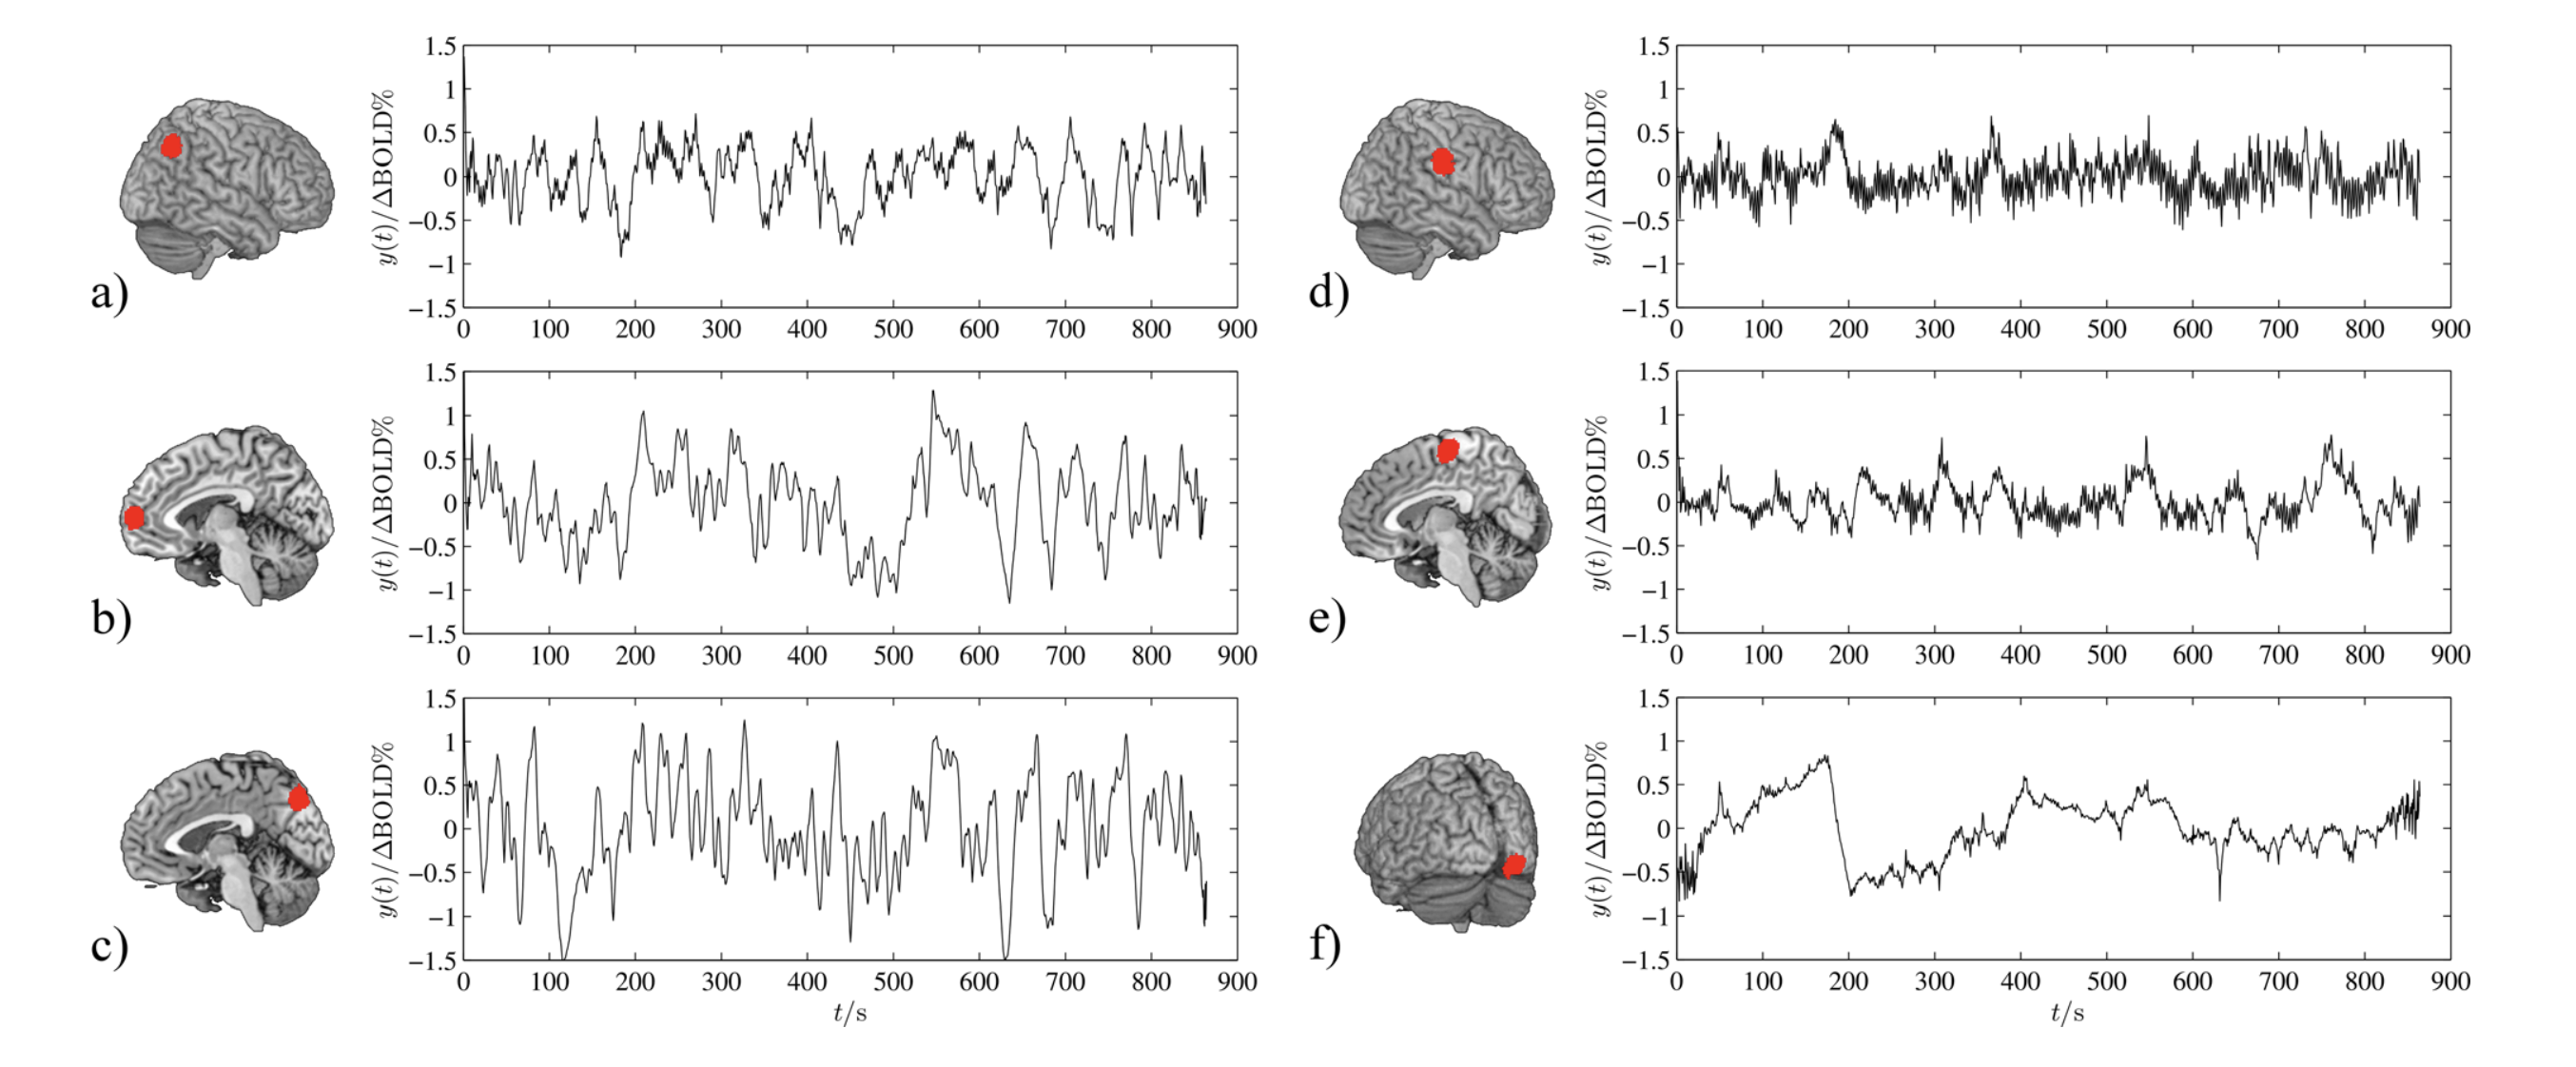
Examples of resting-state fMRI time series extracted from six different brain regions. Each plot shows how the fMRI signal changes over time within a particular region of the brain. Reproduced from https://
Resting-State Functional Connectivity
The most common analysis performed on resting-state fMRI data is resting-state functional connectivity (rsFC).
The basic idea is simple.
Suppose we select two brain regions and compare their time series (i.e., how their region’s activity changes over time)
If the activity patterns of two brain regions fluctuate in a similar way over time, we say that they are positively functionally connected. Conversely, if one region tends to become more active whenever the other becomes less active, the two regions may exhibit a strong negative correlation (also known as anticorrelation).
Researchers often quantify these relationships using a statistical measure such as the Pearson correlation coefficient.
The figure below illustrates the difference between positive and negative functional connectivity. In panel A, the two brain regions exhibit a strong negative correlation (anticorrelation): when activity in one region increases, activity in the other tends to decrease. In panel B, the two brain regions exhibit a strong positive correlation: their activity tends to rise and fall together over time.
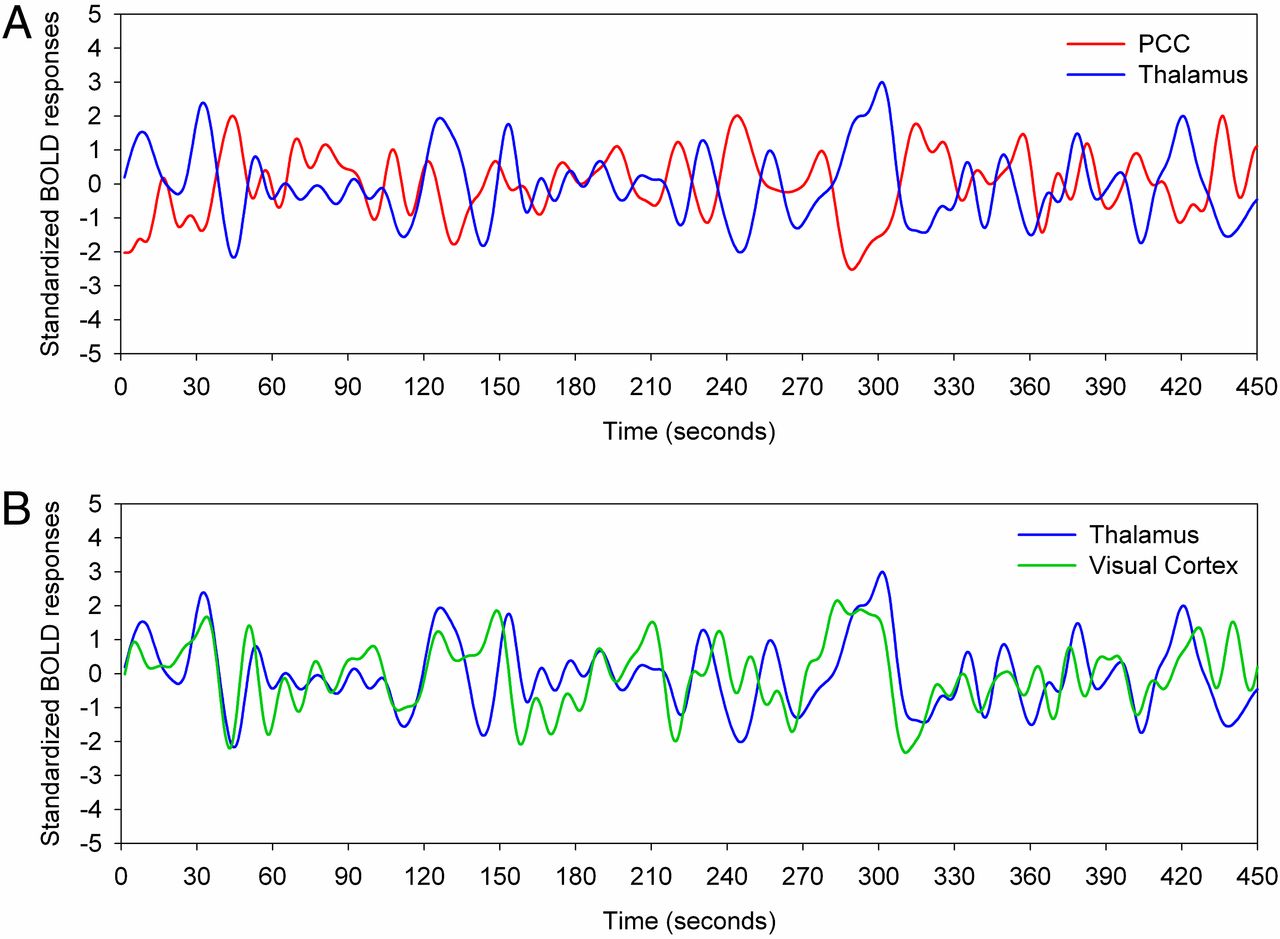
Examples of positive and negative functional connectivity. The plots show fMRI (BOLD) signal time series from pairs of brain regions. In panel A, the posterior cingulate cortex (PCC; red) and thalamus (blue) exhibit a strong negative correlation (anticorrelation). In panel B, the thalamus (blue) and visual cortex (green) exhibit a strong positive correlation. Functional connectivity is commonly quantified by measuring the correlation between the time series of different brain regions. Reproduced from https://
The examples above illustrate an important idea: functional connectivity is fundamentally about the relationship between the activity patterns of different brain regions over time. The stronger and more consistent this relationship is, whether positive or negative, the larger the magnitude of the correlation coefficient.
We can therefore interpret the correlation coefficient as a measure of how strongly two brain regions are functionally connected.
Strong positive correlation (e.g., r ≈ +1) → the two regions tend to increase and decrease together over time.
Strong negative correlation (e.g., r ≈ −1) → the two regions tend to fluctuate in opposite directions over time.
Weak or near-zero correlation (e.g., r ≈ 0) → little or no consistent relationship between the activity patterns of the two regions.
Both strong positive and strong negative correlations indicate a meaningful relationship between brain regions and are therefore often considered evidence of functional connectivity. In contrast, weak or near-zero correlations suggest little evidence of a functional relationship.
By calculating connectivity between many brain regions simultaneously, we can construct a functional connectivity (FC) matrix, which forms the basis of many connectomics analyses.
Below is an example of a functional connectivity matrix. Each cell shows the correlation between the time series of two brain regions.
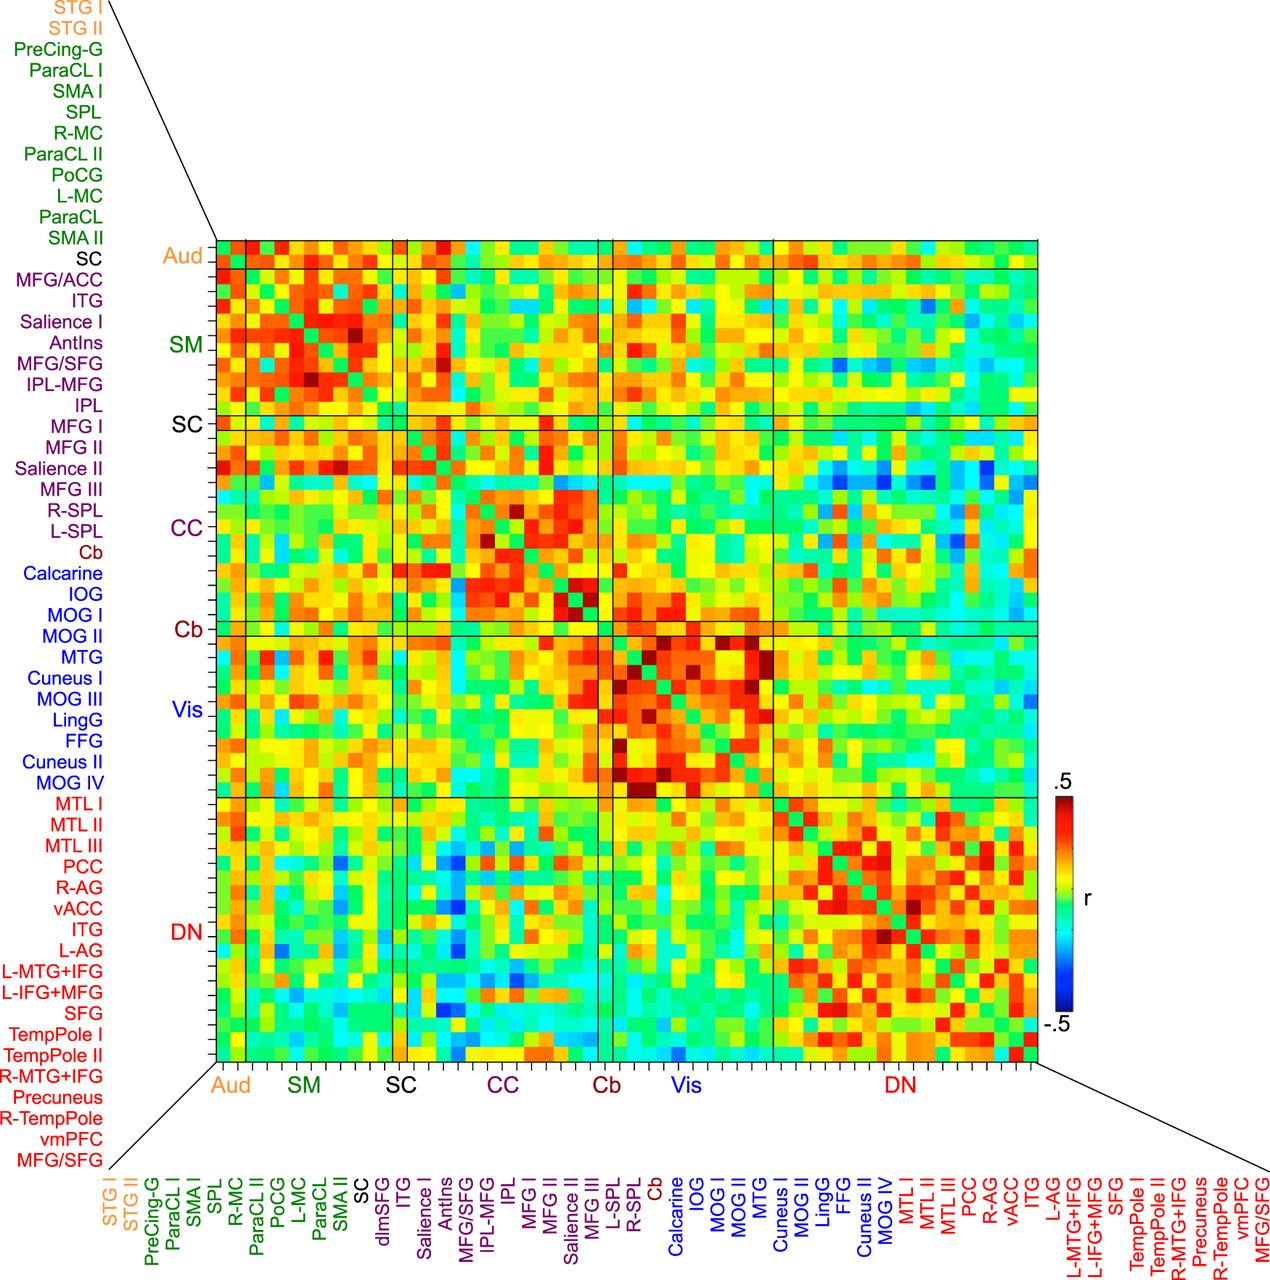
Example functional connectivity matrix showing pairwise correlations (r) between brain regions. Each row and column corresponds to a brain region, and each cell represents the correlation between their time series. Warm colors (e.g., red) indicate stronger positive functional connectivity, whereas cool colors (e.g., blue) indicate negative functional connectivity. Reproduced from Hutchison & Morton (2015).
Resting-State Networks
When researchers began examining patterns of functional connectivity across the entire brain, they discovered that certain groups of brain regions consistently exhibited coordinated activity.
These groups became known as resting-state networks (RSNs).
Some of the most commonly studied resting-state networks include:
Visual Network
Associated with:
Visual perception
Processing visual information from the environment
Interpreting shapes, colors, and motion
Somatomotor Network
Associated with:
Movement
Somatosensory processing
Coordinating sensory information and motor actions
Dorsal Attention Network
Associated with:
Visual attention
Goal-directed attention
Orienting attention toward external stimuli
Salience / Ventral Attention Network
Associated with:
Detecting important or unexpected stimuli
Reorienting attention
Switching attention between different sources of information
Limbic Network
Associated with:
Emotion
Motivation
Reward-related processes
Memory-related functions
Frontoparietal Network
Associated with:
Cognitive control
Decision making
Goal-directed behavior
Flexible problem solving
Default Mode Network (DMN)
Associated with:
Self-referential thinking
Mind-wandering
Memory retrieval
Internal mentation
Together, these networks provide a useful framework for understanding how large-scale brain systems coordinate to support perception, action, cognition, and behavior.
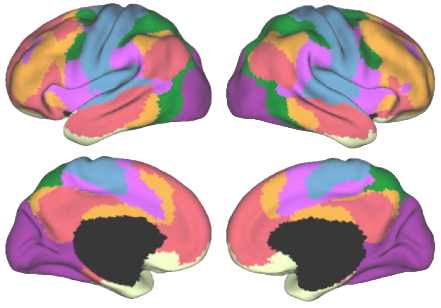
■ Purple — Visual Network
■ Blue — Somatomotor Network
■ Green — Dorsal Attention Network
■ Violet — Ventral Attention Network
■ Cream — Limbic Network
■ Orange — Frontoparietal Network
■ Red — Default Mode Network (DMN)
Beyond Functional Connectivity
Resting-state functional connectivity is one of the most widely used approaches for analyzing resting-state fMRI data, but it is far from the only one. Over the past two decades, researchers have developed a rich collection of methods for studying the brain’s intrinsic activity and network organization.
For example, network or graph-theoretical approaches treat the brain as a network and quantify properties such as efficiency, modularity, centrality, and community structure. Information-theoretical methods investigate how information may be distributed, integrated, or shared across different parts of the brain. Functional connectivity dynamics (FCD) examine how patterns of connectivity change over time, recognizing that the brain is not static even during rest.
Machine learning and predictive modeling approaches allow researchers to investigate whether patterns of brain connectivity can predict cognitive abilities, personality traits, psychiatric symptoms, age, or treatment outcomes. Furthermore, computational neuroscience may combine both structural and functional data to explain how the underlying anatomical structure of the brain give rise to large-scale patterns of brain activity.
Despite their differences, many of these approaches build upon the same underlying data and share a common goal: understanding how large-scale brain activity gives rise to cognition, behavior, and mental health. In this competition, we will focus primarily on functional connectivity and network-based approaches, while also introducing some of the broader analytical perspectives that have shaped modern human connectomics.
Why Is Resting-State fMRI Important?
One of the reasons resting-state fMRI has become so influential is that it allows researchers to investigate the brain’s intrinsic functional architecture.
The term intrinsic refers to patterns of brain activity that emerge naturally, even when a person is not engaged in a specific task. Rather than examining how the brain responds to an externally imposed stimulus, resting-state fMRI seeks to understand the brain’s baseline organization and how different regions communicate with one another under everyday conditions.
Why should we care about this?
Many neuroscientists believe that these intrinsic activity patterns reflect fundamental properties of how the brain is organized. Just as the structure of a city’s transportation network influences how people move through it, the organization of large-scale brain networks may influence how information is processed, integrated, and communicated throughout the brain.
Researchers have found that resting-state networks are remarkably consistent across individuals, yet also exhibit meaningful variation from person to person. These individual differences have been linked to cognition, aging, development, neuropsychiatric and neurological disease.
Another advantage of resting-state fMRI is its simplicity. Participants are not required to learn instructions or perform demanding cognitive tasks, making it easier to collect data from a wide range of populations, including children, older adults, and individuals with neurological or psychiatric disorders.
Resting-State fMRI and Connectome 2026–2027
In this competition, resting-state fMRI data serves as the foundation for understanding the human functional connectome.
Using the LEMON dataset, you will learn how to work with resting-state fMRI data and investigate how intrinsic functional architecture of the brain relate to cognition, behavior, physiology, personality, aging, and mental health.
The next subsections will walk through this process step by step.
- Hutchison, R. M., & Morton, J. B. (2015). Tracking the Brain’s Functional Coupling Dynamics over Development. The Journal of Neuroscience, 35(17), 6849–6859. 10.1523/jneurosci.4638-14.2015
- Thomas Yeo, B. T., Krienen, F. M., Sepulcre, J., Sabuncu, M. R., Lashkari, D., Hollinshead, M., Roffman, J. L., Smoller, J. W., Zöllei, L., Polimeni, J. R., Fischl, B., Liu, H., & Buckner, R. L. (2011). The organization of the human cerebral cortex estimated by intrinsic functional connectivity. Journal of Neurophysiology, 106(3), 1125–1165. 10.1152/jn.00338.2011